Gold on Friday 11-09-2026: up 0.70% with notable moves
📑 Report Contents
Introduction
This report tracks the performance of the global gold price on Friday, 11-09-2026, based on actual trading data for the gold ounce against the US dollar. Below we review the daily session summary, comparisons with earlier milestones, and a reading of volatility and the overall trend, to give followers and investors an accurate picture of the market in September 2026.
Daily Summary
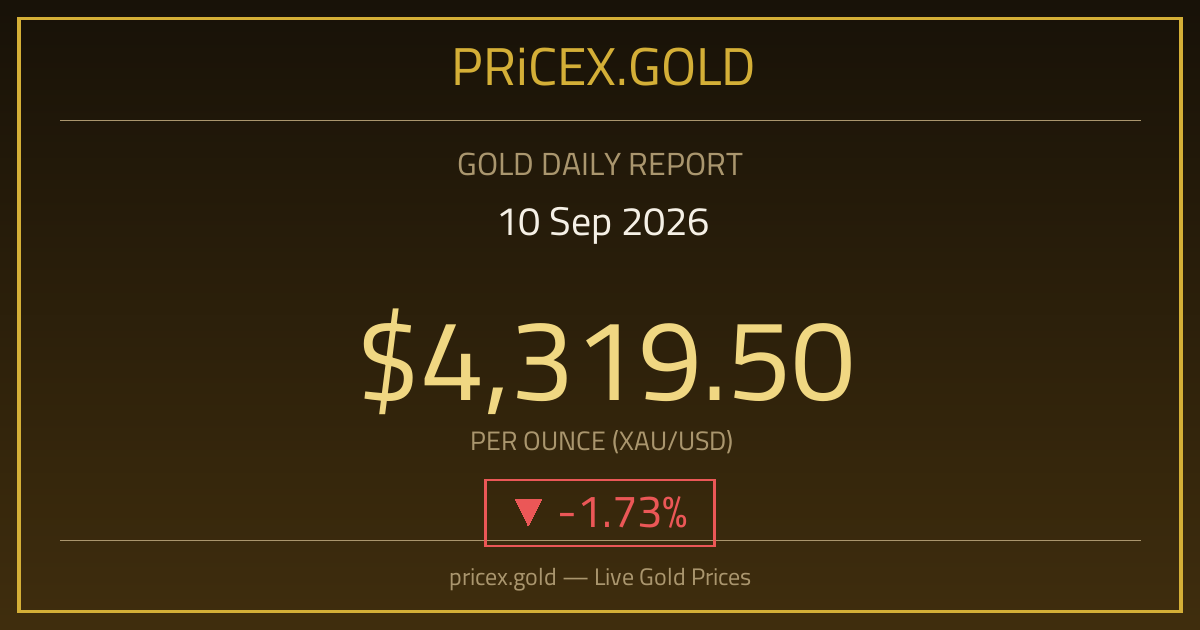
The gold ounce price rose by 0.70% to reach 4,349.70 USD, compared with the previous session close at 4,319.50 USD. During the day the price moved between a high of 4,391.60 USD and a low of 4,329.00 USD, after opening the session at 4,329.60 USD. That is equivalent to a 24-karat gram price of roughly 139.85 USD.
Historical Comparisons
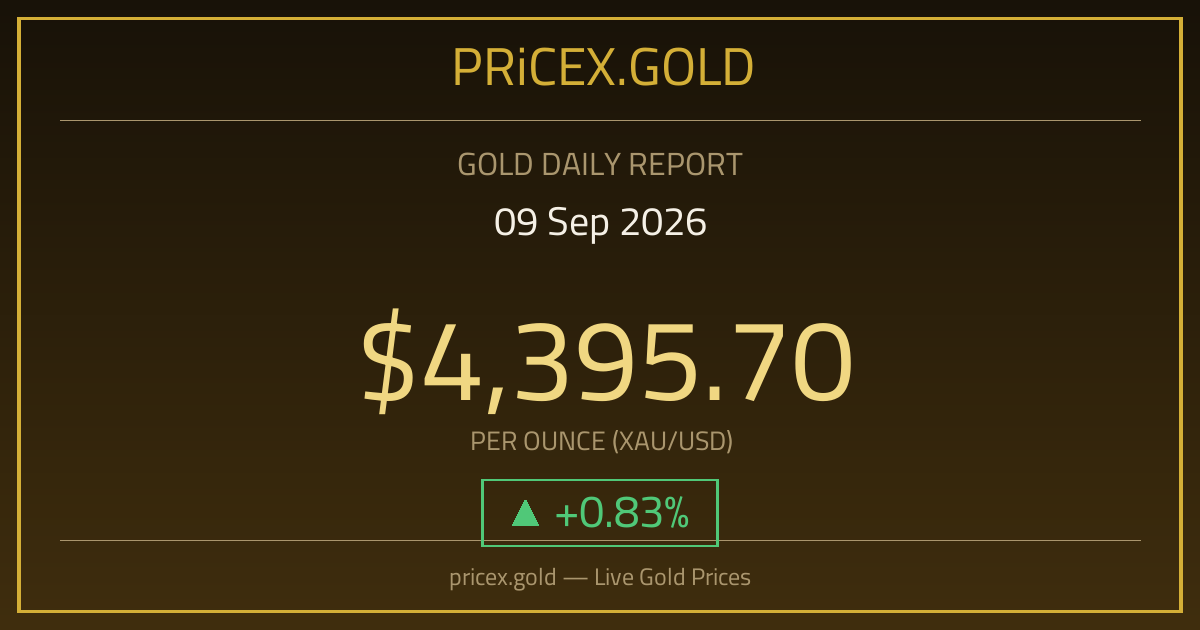
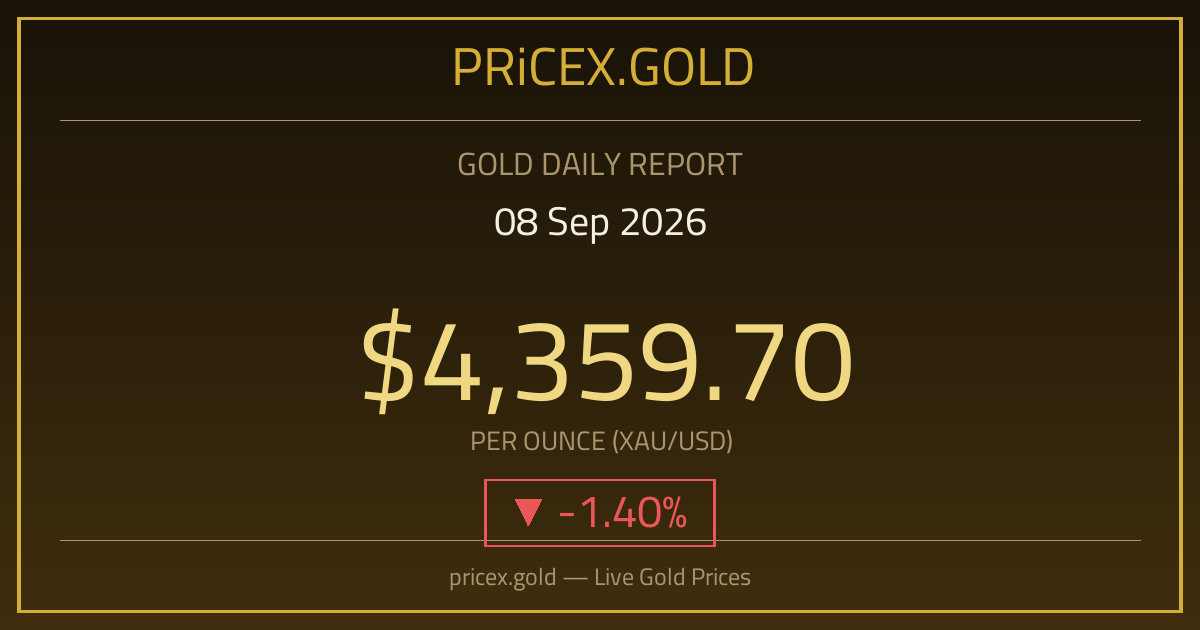
The current price is lower by 1.89% than its level a week ago (on 04-09-2026), when it stood at 4,433.40 USD, while the current price is lower by 5.52% than its level two weeks ago (on 27-08-2026), when it stood at 4,603.60 USD, while the current price is lower by 1.37% than its level a month ago (on 12-08-2026), when it stood at 4,409.90 USD. On an annual basis, gold recorded gains of 19.60% compared with its price a year ago. These differences reflect the phase the yellow metal is going through and help place the daily move in its proper context.
Volatility & Liquidity Analysis
The standard deviation of daily returns over the last thirty days was about 1.44%, indicating high volatility in the market. Prices over this period ranged between a high of 4,660.20 USD and a low of 4,319.50 USD, with an overall average of 4,457.48 USD per ounce. The wider this range, the more risk management and entry/exit timing matter for traders.
Trend Analysis
The seven-day average (4,386.63 USD) sits below the thirty-day average (4,457.48 USD), which suggests a downward bias in the short term. The price crossing back above its monthly average would be an early signal of momentum returning.
Investment Recommendations
Given the currently high volatility, it is preferable to avoid high leverage and to split purchases into batches, with clear stop-loss levels. Diversifying the portfolio and not concentrating it in a single asset remains a constant rule regardless of market direction.
Conclusion
Gold ended the Friday session at 4,349.70 USD per ounce with a change of 0.70%, within a downward short-term trend and high volatility. To follow prices live and convert them to your local currency, you can use the Gold Calculator or browse the Historical Prices.
Statistical Notes
Over the last thirty days: the average ounce price was 4,457.48 USD, the highest close 4,660.20 USD, the lowest close 4,319.50 USD, across 31 observed trading sessions. All figures are based on actual data updated to the time this report was prepared.
Disclaimer
The information in this report is for informational purposes only and does not constitute investment advice. Prices are subject to constant change, and consulting a licensed financial advisor before any investment decision is recommended.